Time Evolution of Non-Stationary States
While the time evolution of stationary states proves to be periodic and predictable, non-stationary states are composed of eigenvectors of different energies, leading to variation in the rates of time evolution.
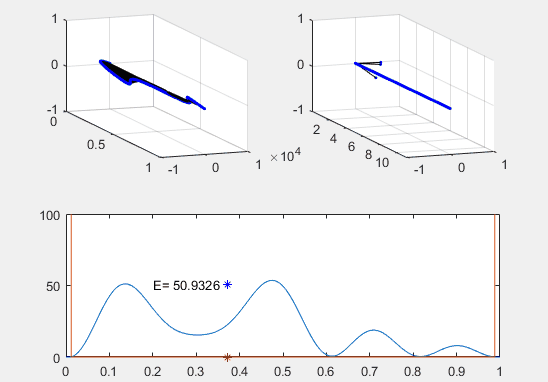
Here’s what the time evolution of a non-stationary state looks like in the position and energy basis. The probability density of finding the particle at a specific position is also plotted. Note how the expectation value for the position changes over time. The first, second, and fifth states are contributing to the overall quantum state in this example - as seen in the three different “lollipops” in the graph of the energy basis.
Because these three energy states are stationary states themselves, the time and position dependence for each state may be separated. The resulting graphs are representations of the equal contributions from these three stationary state to the overall non-stationary quantum state.
This non-stationary state does not time-evolve in a periodic way like stationary states do. This is seen especially in the position space. The idea that this non-stationary state is composed of three different stationary states is depicted clearly in the energy space, as the three different stationary states have different energies and thus rotate through the complex plane at different rates. In the third graph, the energy and position expectation values are depicted by asterisks, and the position expectation value changes with time, as the probability distribution of the particle also changes over time.
Matlab code
function [x,E,psiX,psiE]=TDSE
First a number of different constants must be defined. Here, the mass of the particle (m), the length of the box (L), and ${\hbar^2}$ are all defined as 1 in order to simplify the problem. The height of the barrier is defined as a large number to account for the infinite potential of the box and is set at ${1 x 10^6}$. A new variable w is defined as 3 in order to construct the potential wall, where w is essentially the width of the barrier. The number points used is set equal to 250.
%here are my constants: %m is mass, L is length of box, barht height of barrier, w is the barrier width
m = 1;
L = 1;
hbarsq = 1;
barht = 1e6;
w=3;
pts = 250;
The number of elements in the x vector is now defined. The linspace command is used to create a vector of x values which span from zero to the box length and are composed of pts number of elements. These x elements are evenly spaced between 0 and L. The change in x between all of these points is constant, as the points are evenly spaced and defined here as the difference between the second x element and the first x element.
%now account for the delta x and discritize the number of elements in the x vector
x = linspace(0, L, pts)';
dx = x(2)-x(1);
The potential vector ${Vvec}$ can now be constructed by creating a vector of zeros. This defines the potential energy within the box to zero, and by setting the first and last three entries of the barrier equal to the ${barht}$ defined above, a well with infinite potential is created.
%x is a vector that goes from 0 to L separated by some amount, dictated by the number
%of points. Vvec is a vector with the dimension of pts entries with one column
% now we have points number of entries in the x vector
Vvec = zeros(pts, 1);
Vvec([1:w, end - (w-1):end]) = barht;
%Vvec(120:130) = 75;
%this makes a barrier in the middle of the box
By putting the entries of Vvec on the diagonal of a new matrix, V, the potential energy matrix has been created.
%Now we create the potential energy matrix but putting the entries of Vvec in a diagonal matrix

V = diag(Vvec);
We’ve then created a matrix which will find the kinetic energy of a different matrix. The second derivative of a function can be thought of as how the change in slope of a graph changes, and a similar thought is used here to consider how the change in entries of a vector change. This second derivative matrix shown below is then multiplied by $1/dx^2 $and that resulting matrix is then multiplied by $\frac{\hbar^2}{2* m}$ to determine the total kinetic energy of the vector.
%making the second derivative matrix

D2 = (1/(dx^2))*(-2*eye(pts) + diag(ones(pts-1,1), 1) + diag(ones(pts-1,1),-1));

%now account for the delta x idea by subtracting the first element from the second element because they will be evenly spaced, and multiply the matrix by the constants

T = (-hbarsq/(2*m))*D2;
A new matrix H is then defined as the sum of the potential energy matrix and the kinetic energy matrix, as the Hamiltonian takes both the potential energy and kinetic energy in account in order to solve the total energy of a state.
%here's our Hamiltonian, which accounts for both the potential energy and kinetic energy

H= T + V;
The [vecs, vals] command creates two new matrices which are the eigenvectors and eigenvalues of the matrix, H. The vecs matrix has the eigenvectors of H as columns in the matrix, and the vals matrix has all of the eigenvalues for H on the diagonal of the matrix.
%now we want to solve for the eigenvalues of the square matrix H

[vecs, vals] = eig(H);
The srtvecs commmand, described here puts the eigenvectors and eigenvalues together in ascending order of energy level.
%now we sort the vectors and values so that they are plotted in ascending order of n, but the eigenvalues and eigenvectors stay together
[srtvecs, srtvals] = eigsort(vecs, vals);
Two matrices must now be created in order to change from the position basis to the energy basis so that the wavevector may be represented in the energy basis. The idea behind the change of basis is described on the Change of Basis page. By multiplying the matrix EtoX by the matrix psiE, the corresponding stationary state is found in the energy basis. This example specifically solves for the eigenvector which has equal contributions from the first, second, and fifth stationary states.
EtoX=srtvecs;
XtoE=inv(srtvecs);
psiE=zeros(pts,1);
psiE([1 2 5])=1;
psiX=EtoX*psiE;
The matrix E is now a vector composed of the diagonal elements of the srtvals matrix, which are the eigenvalues sorted in ascending order.
E = diag(srtvals);
The time evolution aspect will now be defined. The dt value determines how quickly the time evolution occurs.
t = 0;
dt = 0.005;
The time evolution of this stationary state can now be visualized. The variable k defines how many points are observed during the time evolution. First the time dependence of the wavevectors in the energy basis is introduced in psiEt. This new matrix can now be changed into the position basis. These vectors are also then normalized, and the concept of normalization is further developed here.
for k = 1:100
%introduce time evolution
    psiEt = psiE.*exp((-1i*E*t)/hbarsq);
    psiXt = EtoX*psiEt
%normalize these vectors
    psiXt = psiXt/norm(psiXt);
    psiEt = psiEt/norm(psiEt);
The probability density of the normalized wavevector is then found in the position space, as the probabiltiy density is represented by the square modulus of the wavevector in position space. This probability density is then scaled in order to be better visualized.
    %the probability density would be the normalized psiX * normpsiX
    %complex conjugate
    prob = 5000* abs(psiXt).^2;
Ultimately, this non-stationary state is plotted in position space and energy space. The probability density of the wavevector is also visualized on the figure as well.
 figure(1)
 subplot (2,2,1)
    AW_plot3 (x, 5.*psiXt,1)
 subplot (2,2,2)
    AW_plot3 (E, psiEt,10)
 subplot (2,2,[3 4])
    plot(x, prob, x, Vvec)
    axis([-inf inf 0 100])
The expectation value for position are then determined by finding the inner product of the position operator acting on the wavevector and the complex conjugate of the wavevector. The energy expectation value is calculated in a similar fashion as well.
% expectation value for position, plotted with a red *
   xexp = real(psiXt'*(x.*psiXt));
   hold on
   plot (real(xexp), 0, 'r*')

% energy expectation value in energy basis
   Eexp=real(psiEt'*(srtvals*psiEt));
   plot (xexp, Eexp, 'b*')
   text(0.2,Eexp,['E= ' num2str(Eexp)])
 hold off

 drawnow
t = t + dt;
end

end